E-commerce replenishment: the method to drive your reorder points
A replenishment method rebuys against real sales, not guesswork. You measure each SKU's selling pace, set a reorder point and a safety stock, then let the system propose the order while the operator validates. One retailer cut purchasing from 2 days a week to a 30-minute review and took top-seller stockouts to zero.
Replenishment is the decision that comes back every week: what to rebuy, and how much. Many merchants settle it by guesswork, or with an Excel minimum that never moves. On one side, the best sellers run out; on the other, the warehouse fills with dead stock. Both are costly: according to analyst firm IHL Group (2025), stockouts and overstocks cost global retail $1.73 trillion a year, 6.5% of sales. There is a method to escape that trade-off.
That result comes from a multi-brand lifestyle retailer we worked with on these operations. They sell on Shopify, Amazon and two niche marketplaces. This article walks through the method step by step, with a worked example and the place each calculation holds inside a tooled purchasing flow.
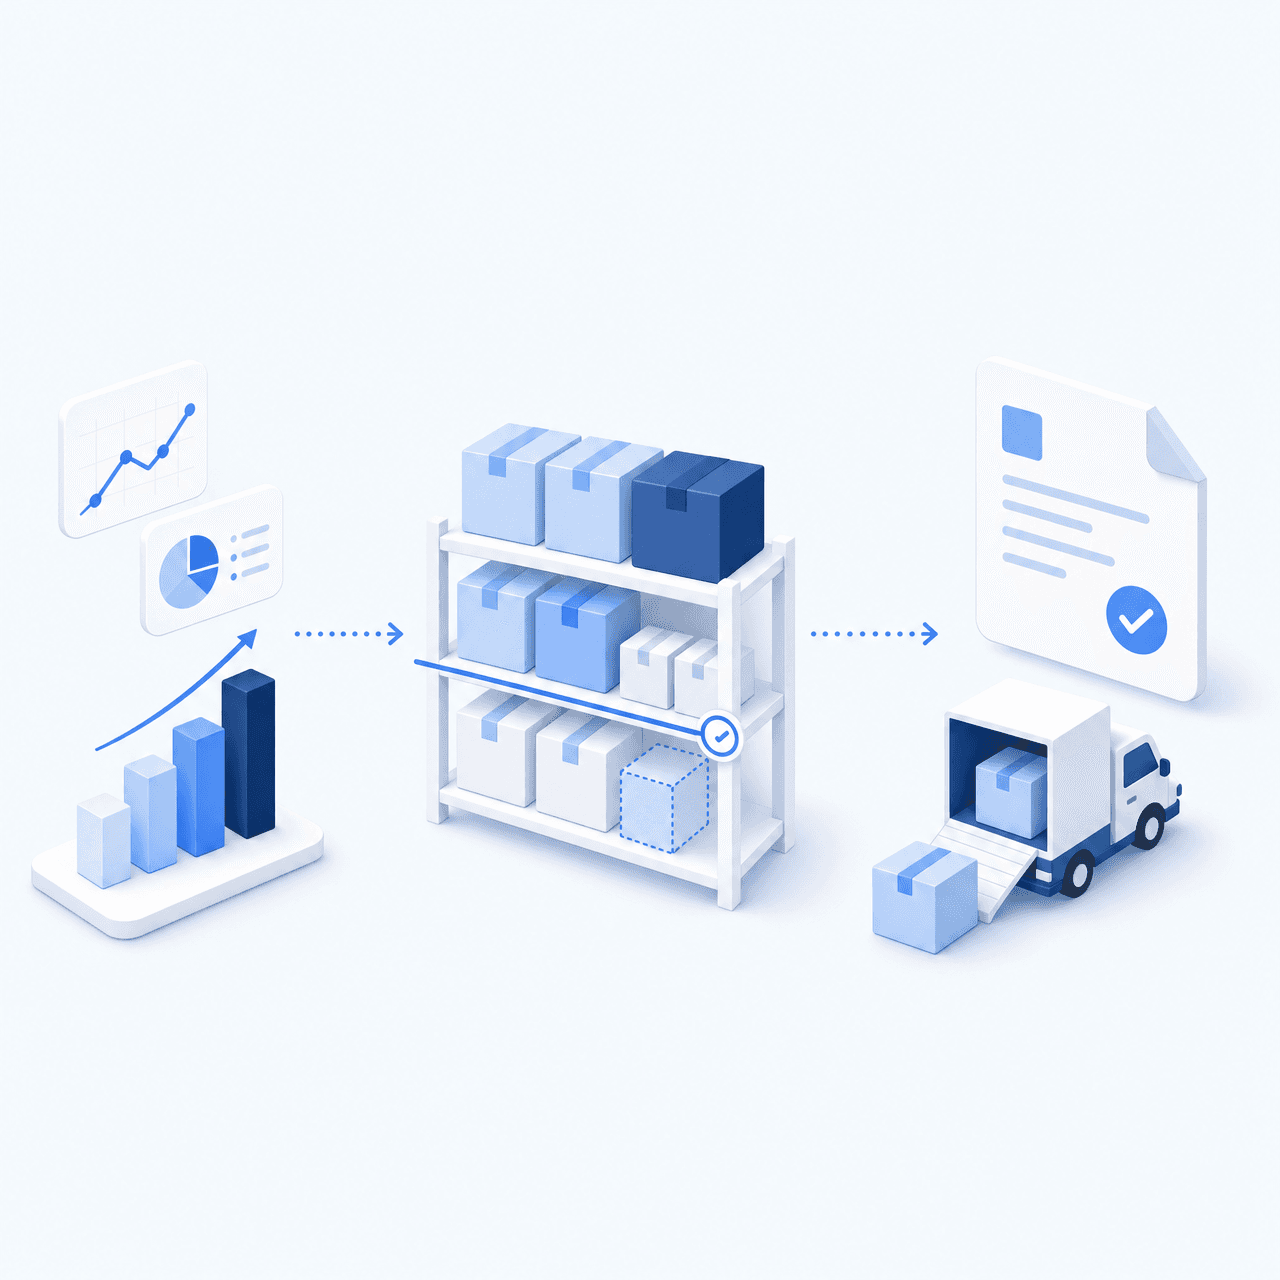
The system proposes at each step; the operator validates the purchase order.
The replenishment methods (and which one for e-commerce)
Before you calculate anything, you have to pick a replenishment logic. The methods split on two axes: the trigger (a fixed date or a stock threshold) and the quantity (a fixed volume or one recalculated each time).
Continuous but uneven demand, known lead times: trigger on a threshold, not the calendar.
The matrix places the three core methods. Beyond it sits replenishment to level, which refills toward a target stock. The Push/Pull and DDMRP logics sit there too, deciding between ordering on forecast or on real demand. EOQ itself is no novelty: Ford W. Harris set it out in 1913, in an article since reprinted in Operations Research. But it assumes stable demand, rare in e-commerce.
For most e-commerce catalogs, the sensible default is the reorder point coupled with a dynamic Min-Max. Demand is continuous but uneven, supplier lead times are known, and the right reflex is to trigger on a threshold rather than on the calendar.
Measure the selling pace (12 / 4 / 2-week windows)
Everything starts with sales velocity: how many units a SKU sells per week, on average, over a recent window. Without that figure, no reorder point means anything.
The spreadsheet trap is the single window. If you always look at the last 30 days, you flatten accelerations and miss new launches. The method reads several rolling windows in parallel:
| Window | What it captures | Use it for |
|---|---|---|
| 12 weeks | The underlying trend, smoothed of noise | Stable SKUs, the baseline |
| 4 weeks | The current rhythm | Most replenishment decisions |
| 2 weeks | A recent acceleration, a launch | Spikes, new items, seasonal goods |
The short window is your early warning, the long one is your guardrail. In myFulfillment, sales history analysis is set on these windows and the system computes an average velocity per SKU from real sales. It also cross-checks the recent trend against the same period last year. That adjusts the calculation for seasonality without anyone retouching minimums by hand. That is what the retailer in the intelligent replenishment case study lacked. Their Excel minimums never moved, so summer top sellers ran out while winter items sat idle.
Calculate the days before stockout (available stock, backorders, supplier lead time)
Once velocity is known, the question becomes: how many days until this SKU hits zero? That is the days-before-stockout indicator.
The base calculation is simple: you divide stock by velocity. But two refinements change everything.
First, use available stock, not physical stock. Available stock is the physical quantity minus what is already reserved for open orders. That is the genuinely sellable stock, so that is what feeds the calculation. Reasoning on physical stock overstates your cover and lands you late.
Second, account for backorders and supplier lead time. Backorders are orders already taken but not shippable for lack of stock: they consume your next units before they even arrive. The supplier lead time sets the horizon. If you hit zero in ten days but the resupply takes fifteen, you are already out. The goal is not to order when stock reaches zero, but before the supplier lead time creates the stockout across your peak weeks.
In the product, the Stock Helper surfaces days before stockout per warehouse, with supplier lead time built in. When projected cover drops below the threshold, the SKU automatically rises into the purchasing recommendations table.
The reorder point (replenishment threshold)
This is where most of the method is decided. The reorder point is the stock level that should trigger the order. You will meet it under several names for the same thing: reorder point, replenishment threshold, reorder level, or ROP. The safety stock is the buffer that absorbs the unexpected: a demand spike, a late supplier.
A generic, readable formula is enough to drive the operation:
Reorder point = (daily velocity x supplier lead time) + safety stock
Reading the example: as soon as available stock drops to 340 units, you reorder. The 240 units cover sales while the supplier prepares and ships, and the 100 safety units absorb a spike or a delay. If velocity climbs to 30 per day, the reorder point rises on its own, something a fixed spreadsheet minimum never does.
One distinction holds the whole method together: the reorder point tells you WHEN to order, not HOW MUCH. The how-much comes from the min/max per SKU and the one-click purchase order. That pair took the retailer we worked with from 2 days a week in Excel to a 30-minute review. It also took top sellers from 15 to 20 stockouts a month down to zero.
The safety stock formulas (and the one we actually use)
Safety stock is calculated in three ways, from the simplest to the most statistical.
| Family | Formula | For whom |
|---|---|---|
| Simple (days of sales) | Average sales x safety days | Stable SKU, reliable lead time |
| Average-max | (Max sales x Max lead time) − (Avg sales x Avg lead time) | Variable supplier lead time, demand that drops off |
| Statistical (normal law) | Z x demand standard deviation x sqrt(lead time) | Critical, very high-volume SKU |
Take the average-max method on an example: max sales 30/day, max lead time 18 days, average sales 20/day, average lead time 12 days. Safety stock equals (30 x 18) − (20 x 12), that is 540 − 240 = 300 units. The statistical method depends on a Z coefficient tied to the target service level. 90% service gives 1.28, 95% gives 1.645, 99% gives 2.33. The higher the service level, the larger the buffer.
Our operator verdict: most e-commerce SKUs do not need statistical safety stock. A buffer in a few days of sales plus dynamic replenishment beats a frozen Z formula, because the Z freezes a variability that itself keeps changing. How to choose the number of days? Use few days on a stable SKU with a reliable lead time. Use more on a volatile SKU, or on a critical SKU whose stockout costs a lot. Reserve the average-max or statistical formula for the few SKUs where a stockout is unacceptable.
Let the system propose the min/max per SKU
From here, the operator no longer has to decide what to order. For every SKU due for replenishment, the Min-Max system suggests a minimum and a maximum quantity to order. Each comes with a pack quantity estimate and a shipping delay.
The minimum quantity covers the need up to the next realistic delivery. The maximum quantity factors in your capacity and optimal stock duration, so you do not over-buy a SKU that is slowing down. The operator reads the proposal, adjusts it if they hold field knowledge the system lacks, and validates.
The principle never moves: the system proposes, the operator validates. Never an autonomous purchase, never an AI ordering behind your back. As the buyer at the retailer we worked with put it: "We do purchasing by hand. It's truly time-consuming." The method does not remove the buyer, it removes the data entry.
Trigger the purchase order in one click (landed costs and margin already calculated)
A recommendation is worthless if turning the line into a purchase order takes half an hour. So the method needs a last link: moving to purchase must be immediate.
In the product, purchase orders are pre-built from the replenishment needs and grouped by supplier, ready to review and send in one click. You fill with the suggested min or max quantity and add the line to the purchase order. The PO then follows a clear status cycle, from Draft to Sent then Expected and Complete, with partial receiving and supplier notification by email.
Two figures must be set before sending, not after. The purchase order calculates a landed cost that includes freight and taxes, plus the matching margin. The operator therefore triggers the purchase with the margin already known, rather than discovering it when the invoice arrives. That is what turns replenishment from a logistics act into a commercial decision you actually hold.
Stock turnover rate: reading the health of your replenishment
The stock turnover rate measures how many times you sell through and rebuild your stock over a period. Read it as a report, rather than chasing it blindly. A useful reading along the way: average days in stock = 365 / turnover rate, the average number of days a unit spends in stock.
Its reading is diagnostic:
- A rate that rises without creating stockouts signals replenishment well tuned to real demand: you tie up less cash for the same service level.
- A rate that collapses reveals dormant stock, quantities ordered too high against true velocity.
- A rate that spikes but comes with stockouts points the other way: reorder point or safety stock set too low.
No universal threshold applies: a seasonal product and a core basic do not share the same target turnover. What helps is tracking the trend per family and crossing it with the stockout counter. At the retailer we worked with, turnover improved while stockouts on top sellers went from 15 to 20 a month down to zero. It is that combination, not the rate alone, that tells you a method holds.
The other side: avoiding overstock (capacity, dormant products)
A replenishment method that only watches stockouts ends up filling the warehouse with products nobody buys. The other half of the job is braking at the right moment.
The main lever works on its own: a dynamic replenishment cuts ordered quantities when velocity declines. Where a fixed minimum keeps rebuying a product that no longer moves, a velocity-based threshold drops by itself. At the retailer we worked with, that is what took overstock on slow movers from chronic to controlled.
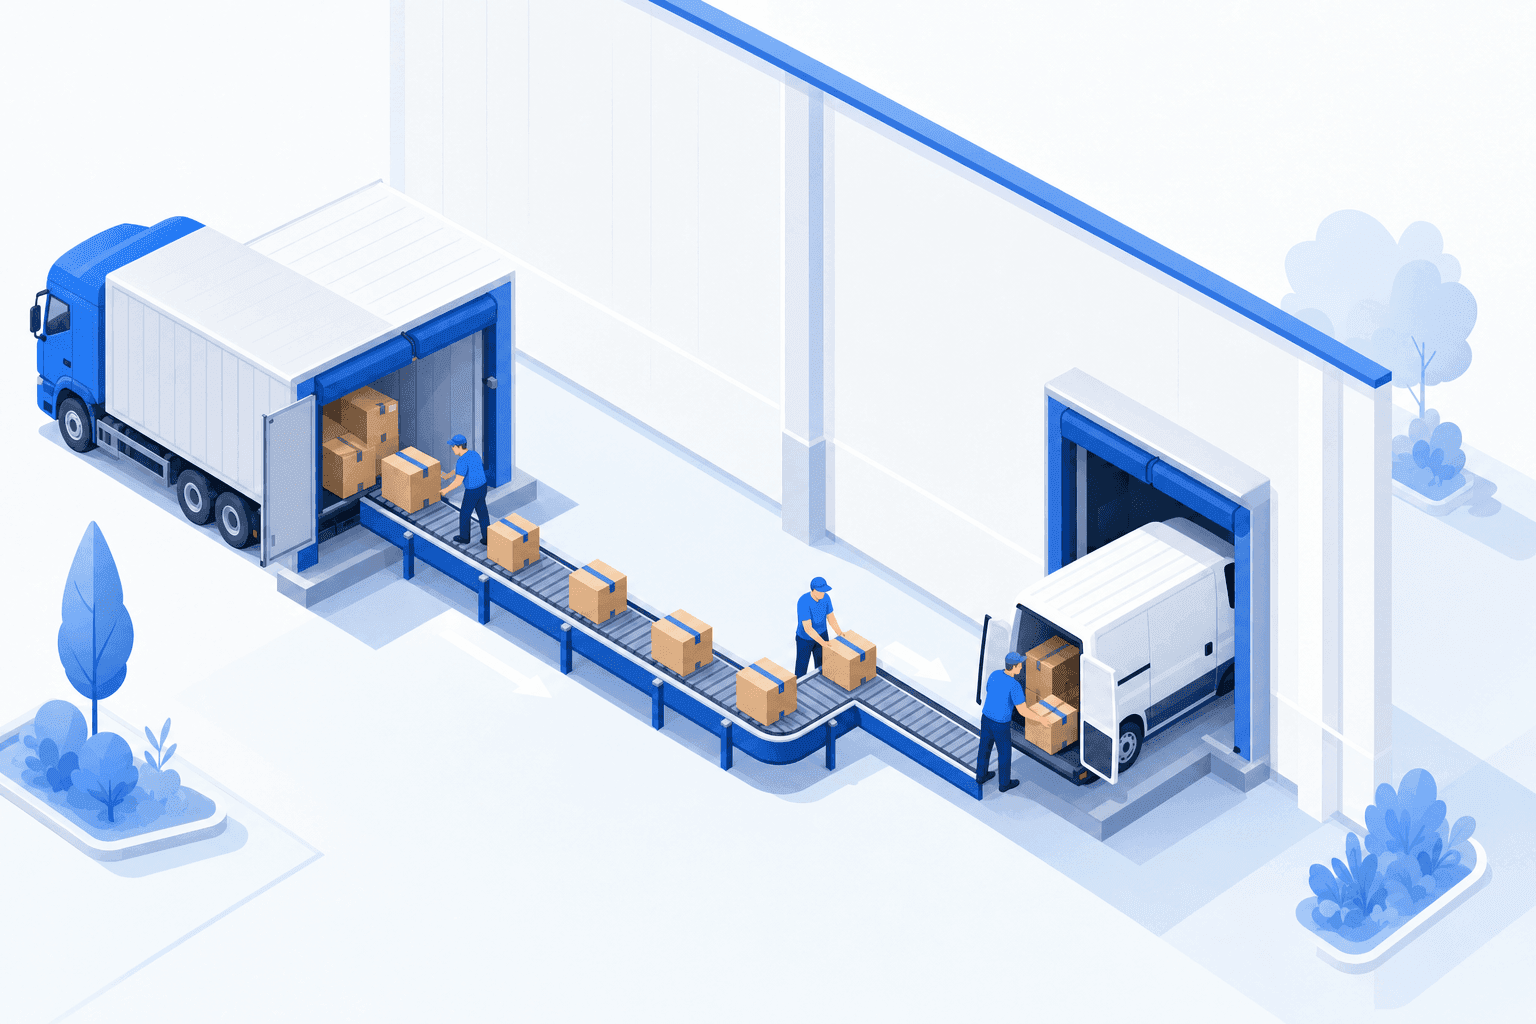
The Stock Helper adds explicit guardrails: maximum storage capacity, optimal stock duration, warning and ideal stock levels, and discontinued-product flagging. In practice, you set a ceiling per SKU so capacity does not saturate. You also take products you no longer want to rebuy out of the replenishment calculation. It is the same real-demand logic, applied in the other direction. If you run flows where goods must never sit, the cross-docking guide extends this idea all the way to receiving without storage. Two cases show it at scale: the multi-supplier cross-dock of an auto-parts distributor and the supplier-side cross-dock and dropship automation.
When to automate (purchase rules, optional validation)
As long as you track a few hundred SKUs, a manual review of the recommendations is enough. The switch to automation is justified when the SKU count exceeds what a hand review can hold. The retailer we worked with shows it plainly: 12,000 SKUs and 2 days a week spent in Excel is no longer drivable by hand.
Automation happens in stages, not all or nothing. Purchase orders can be created manually or automatically from the replenishment needs. The purchase rules behind them are priority-based and triggered by condition, scoped per store or warehouse. You keep an optional validation step: the system generates the PO from your rules, the operator validates before sending. For controlled flows like dropship, the PO can even be auto-sent to the supplier by email, file or API.
The measured result at the retailer frames the goal. The 2 weekly days of purchasing fell to a 30-minute review. Stockouts on top sellers went from 15 to 20 per month down to zero within the first quarter. The buyer sums it up: "No more emergency supplier calls. The system tells us what to order before we even think about it."
To see this method tooled end to end, from velocity measurement to purchase order, look at the myFulfillment replenishment and purchasing page. Our procurement masterclass walks through it live.
Frequently asked questions
Reorder point = (daily velocity x supplier lead time in days) + safety stock. Example: 20 sales a day, a 12-day lead time and 100 safety units give (20 x 12) + 100 = 340. As soon as available stock drops to 340, you reorder.
Three families: simple (average sales x safety days), average-max ((max sales x max lead time) − (avg sales x avg lead time)), or statistical (Z x standard deviation x sqrt of lead time, with Z = 1.28 / 1.645 / 2.33 for 90 / 95 / 99% service). In e-commerce, "a few days of sales" is usually enough.
Stock cover is the number of days before stockout: available stock divided by sales velocity. Turnover rate measures how many times you sell through and rebuild stock over a period. Link: average days in stock = 365 / turnover rate.
The reorder point coupled with a dynamic Min-Max. E-commerce demand is continuous but uneven and supplier lead times are known: triggering on a threshold beats calendar replenishment. We leave EOQ and frozen normal-distribution models aside, too rigid for a catalog that moves every week.
No. The system proposes a min and max quantity and a pre-filled purchase order, but the operator validates and sends. Even automatic purchase rules keep an optional validation step: the system proposes, the operator validates, never the other way around.
Yes. The engine is demand-driven and factors the backorder quantity alongside the forecast replenishment need. So one purchase order restocks the shelf and covers orders already sold but not yet shipped, with no need to run two separate flows.
When the SKU count exceeds what a hand review can hold. The retailer we worked with started at 12,000 SKUs and 2 days a week in Excel: at that scale, automating purchase orders with optional validation cut the review to 30 minutes per week.
Continue exploring


When volume spikes, order preparation is the first thing to break: the wrong item in the box, late shipments, returns piling up. The method to make your whole chain reliable, from picking to dispatch, and get through peak season without sacrificing your lead times or your reviews.
Industrializing your purchasing means ordering on rules, not guesswork: at the right time (the reorder point), in the right quantity (your coverage period), from the right supplier, with a purchase order validated in one click. Available on replay.
See it on your own operations
Book a 20-minute call. We'll map your workflow and point out where it breaks. No slides.
Free 20-min call · No commitment