

Ecommerce peak season: an operator's readiness plan
Start planning your ecommerce peak season 16 weeks before demand rises. Convert the forecast into picking hours, packing hours, station capacity, carrier-cutoff time, and returns work. Compare each workload with productive hours and the time left before the carrier pickup.

The essentials
- Start 16 weeks before the first busy day. That window lets the team test rates, reserve capacity, and validate a fallback.
- Census Q4 2025 growth ranged from -0.4% to +71.9% by category: size your peak from your product mix, not the 21.8% average (2026 supplemental table).
- Divide order lines by the measured pick rate. Divide orders by the packing rate at each station. One order line is one item in an order.
- Start with the carrier pickup. Subtract handoff, packing, and picking time to set the last safe wave release.
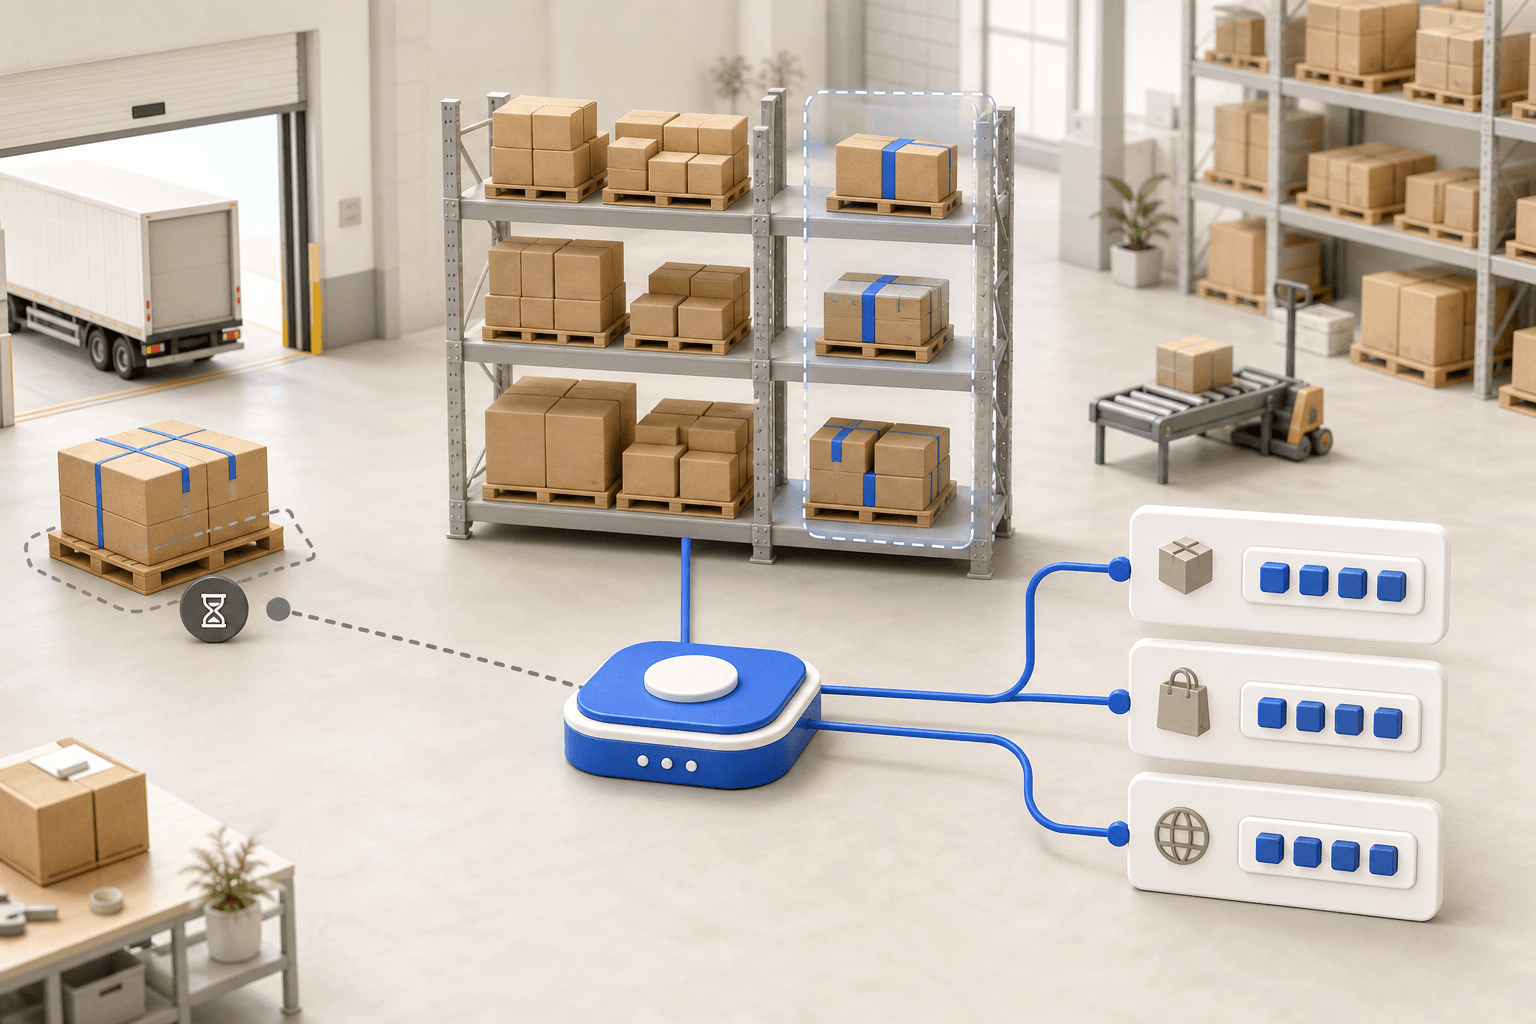
- myFulfillment groups orders by item location, checks picks by barcode, and applies the carrier rules set by the team.
An electronics distributor shipped over 3,000 parcels a day. Its operators still copied every address into three separate carrier portals. They spent two hours a day creating labels.
The label error rate ranged from 5 to 8% of shipments and reached 8% during peak. Each correction took 15 to 20 minutes. At that daily volume, the team faced about 240 bad labels and 60 to 80 hours of rework (multi-carrier shipping case).
The problem existed before peak. More orders piled up in front of a step that was already too slow. Another warehouse might be short of picking time, pack benches, available stock, or time before the last pickup.
The US Census Bureau shows why one growth rate cannot size a warehouse. Seasonally adjusted US retail ecommerce sales rose 1.7% from Q3 to Q4 2025. The unadjusted series better reflects the volume warehouses handled; it rose 21.8% to $365.2 billion (Quarterly Retail E-Commerce Sales, 4th Quarter 2025, release CB26-42, March 10, 2026).
The same unadjusted series fell 20.3% between Q4 2024 and Q1 2025. The warehouse therefore needs a plan for removing peak capacity as well as adding it. Temporary space and labor need an end date.
Ecommerce peak season: calculate your own multiplier
The Census category figures range from -0.4% for motor vehicles and parts to +71.9% for health and personal care. Clothing and accessories rose 48.5%. Total retail ecommerce grew 21.8%, but that average describes none of those categories (Census Bureau supplemental table by kind of business, Table 1, 2026).
The categories range from -0.4% to +71.9% in the same quarter. Forecast the work from the products you sell.
The category spread matters more than the total for warehouse staffing. Staff your dock based on your own product mix, not that average. A warehouse selling clothing will see a different curve from one selling auto parts.
Build three scenarios. The committed scenario records what you have promised suppliers and carriers. The likely scenario sets the roster and station count, while the high scenario reserves fallback capacity.
For each scenario, plot orders by hour. Add order lines; one order line is one item in an order. Mark the first high-demand day, the last promised ship date, and the start of the returns tail.
NRF measured US holiday sales from November 1 through December 31, 2025, up 4.1% year over year (NRF Retail Monitor, December data, January 12, 2026). Anchor every date in the plan to those two months.
Calculate capacity with rates your team tested
Picking is the work of taking items from their storage locations. Divide order lines by the measured pick rate. Then divide orders by the measured packing rate at each station.
Compare the hours required with the hours when people and stations are productive. Do not count every paid hour as productive time. Breaks, printer refills, and blocked aisles all reduce available time.
De Koster, Le-Duc, and Roodbergen studied how a picker spends that time (European Journal of Operational Research, 2007, open-access ERIM copy). Travel takes about 50%, search 20%, and the pick itself 15%. A test in one dense, freshly replenished aisle hides half the job.
Time one complete wave, then repeat the test with a second crew. A wave is a batch of orders released to the warehouse together. Compare the results to find the remaining training gap.
The myFulfillment wave assistant groups selected orders by item location. The handheld terminal sends the operator to the next bin and checks each barcode scan. A temporary worker hired at T-2 can follow the route without memorizing the building.
At the multi-channel retailer we supported, new operators once trained for three months. They now train in two weeks. Wrong locations or barcodes will still send them to the wrong item.
Picking: lines ÷ measured pick rate
Packing: orders ÷ measured pack rate
Capacity: people or stations × productive hours × utilization ceiling
The team finishes packing at 4:50 p.m. and hands the parcels over before the 5:30 p.m. pickup. The team has 40 minutes for staging and handoff.
More pickers would feed a queue that is already full. Increase available pack-station hours before adding picking headcount.
Replace each rate with one your own team has timed, and calculate picking and packing separately; the full-wave test gives you both. In the peak-season picking and shipping webinar, operators follow an order from release to tracking.
The complete file
Capacity worksheet with every formula
Reading the page is free. The file is available with your work email.
Commit money and people between T-16 and T-4
At T-12, the procurement team turns each scenario into supplier orders. It protects promoted SKUs that sell quickly. It confirms delivery dates in writing and flags any purchase order that will arrive too late for inspection.
Set safety stock for each SKU. Use demand variation, lead time, supplier reliability, and the cost of a stockout. The replenishment method explains how to set reorder points without giving every product the same percentage buffer.
At T-8, the warehouse team changes slotting, which means choosing where each item sits. It assigns the fastest-moving SKUs to the easiest-to-reach pick faces. It also names an overflow location and defines when reserve stock moves into the pick face.
Some incoming goods can leave again without going into storage. Use the cross-docking guide to keep that path separate from normal receiving. Operators can then see which pallet belongs to which flow.
- T-16Demand scenarios approvedOperations
- T-12Supplier dates confirmedPurchasing
- T-8Slotting and overflow setWarehouse
- T-6Full wave testedWarehouse
- T-4Pickups confirmedCarrier manager
- T-1Rules frozen and drill completeIT / operations
- Peak dayQueues managed against cutoffOperations
- T+1Returns area staffedWarehouse / customer service
One person owns each deadline. If that person decides too late, the team must use its tested fallback.
Approve spending and temporary labor before T-4. Keep the remaining weeks for tests, training, and the configuration freeze. An extra pack bench adds capacity only when it also has a printer, scale, scanner, labels, cartons, and tested carrier services.
Work backward from the carrier pickup
The carrier pickup is the time when the truck takes the parcels. The driver will not wait for an unfinished wave. At T-4, get a written schedule for every warehouse, service, and peak date.
The schedule must show normal pickups and peak exceptions. It also needs parcel limits, the manifest close time, and an escalation contact. The warehouse team then knows the deadline to meet.
- Last safe wave releaseThe time you need to calculate
- PickingMeasured duration of a full wave
- PackingReal carrier mix
- Staging and handoff40 min between 4:50 and 5:30 p.m.
- Pickup at 5:30 p.m.Confirmed peak schedule
The carrier sets the pickup time. Subtract handoff, packing, and picking to find the last safe release. A later wave will miss that truck.
Start with the pickup time. Subtract handoff, packing, and picking to find the last safe wave release. If nobody has timed a complete wave, that release time is still a guess.
The team assigns a carrier service to each parcel with routing rules. In myFulfillment, the team can base those rules on postal code, weight, dimensions, value, or product type. The team can also set a separate rule for each marketplace.
Freeze those rules at T-1 and keep the saved version. After an incident, the team can compare two precise configurations. At the distributor in the opening, routing rules cut label work from two hours a day to under ten minutes.
Test one domestic order, one international order, one multi-parcel order, and one deliberately invalid address. For every valid shipment, the system must return a usable label and tracking number. The transport management module centralizes this handoff, but the team must still check carrier service-code changes.
At T-1, lock the routing, wave, barcode, printer, and carrier rules. Every later change needs an owner, written rollback steps, and another test. Finish with a 30-minute drill: remove a pack station, move a pickup earlier, and inject a stock shortage.
Run peak week with six signals
At every check-in, estimate when each open queue will finish. Compare that time with the pickup. The team can see which parcels are about to miss the truck.
| Signal | Compare with | Action | Owner |
|---|---|---|---|
| Released lines | Tested pick hours left | Cut the wave | Warehouse lead |
| Pack queue | Tested station-hours left | Open overflow station | Packing lead |
| Label failures | Max exception age | Assign an owner | Carrier manager |
| Stock shortages | Allocatable quantity | Hold releases | Procurement |
| Cutoff buffer | Agreed ship-by buffer | Prioritize or reroute | Operations lead |
| Returns waiting | Daily inspection hours | Open returns area | Returns lead |
Set each threshold based on a test and a customer promise. Read the pack queue as a countdown. Prioritize parcels by the time remaining before pickup.
For each fallback, write down what happens to the customer's order. Ask the customer to correct an address that still fails after a second validation attempt. Instead of making an unapproved substitution, stop allocation when available stock no longer covers released demand.
At T+4, compare the forecast with the result. Record order volume, lines per order, pick rate, and pack rate. "Start earlier" does not identify a cause.
Staff the returns operation too
NRF and Happy Returns estimated 2024 US returns at $890 billion, or 16.9% of annual retail sales. Retailers expected the holiday return rate to be about 17% above their annual rate (2024 Consumer Returns in the Retail Industry, December 5, 2024). Applying that uplift to the US all-retail baseline gives a holiday rate close to 20%.
Use your own return rate in the plan. Multiply expected returns by the minutes needed to inspect one item. Compare those hours with the time available from trained operators, then set aside a clearly marked quarantine zone.
The operator classifies each return as sellable, repairable, incomplete, or quarantined. A named person then decides whether the item goes back into stock or moves to the next step. The warehouse management module stores that status on the item.
Fix the one constraint that is blocking you
The distributor in the opening centralized its multi-carrier flow. Label errors fell from a 5-to-8% range to under 1%. The same team then handled 40% more peak volume.
The multi-channel retailer sold across five channels and used to ship 1 to 2 days late. It now ships the same day. A DTC fashion brand brought logistics back from a 3PL and replaced an estimated, unverifiable 3 to 4% mispick rate with a tracked rate below 0.5%.
At a Lyon-based 3PL, handheld guidance now gives each picker a route. Picking errors went from frequent to near-zero. The 3PL's client said it would have been unable to handle its holiday 2025 growth without the migration.
Operators use one screen for every carrier
September 4, 2026
Operators process an order without opening 3 to 5 tabs
September 3, 2026
The system records every pick
September 3, 2026
Operators no longer retype orders
September 4, 2026
The four teams started with different problems.
Each team named its bottleneck before changing anything.
Sources
- US Census Bureau, Quarterly Retail E-Commerce Sales, 4th Quarter 2025 (CB26-42), March 10, 2026. Adjusted and unadjusted series, plus the supplemental table by kind of business.
- National Retail Federation, NRF Retail Monitor: December 2025 data, January 12, 2026.
- National Retail Federation and Happy Returns, 2024 Consumer Returns in the Retail Industry, December 5, 2024.
- R. de Koster, T. Le-Duc, K.J. Roodbergen, Design and control of warehouse order picking: a literature review, European Journal of Operational Research, 2007.
- Boostmyshop customer cases: electronics distributor, multi-channel retailer, DTC fashion brand, and Lyon-based 3PL.
Frequently asked questions
It is any planned period when orders, items to pick, shipments, and returns exceed normal load. One order line is one item in an order. The dates follow your promotions, delivery promises, and returns pattern.
Start 16 weeks before the first busy day. Approve scenarios at T-16, supplier commitments at T-12, slotting at T-8, the wave test at T-6, pickups at T-4, the roster at T-2, and rules at T-1.
Divide order lines by the measured pick rate. Divide orders by the packing rate at each station. Compare those hours with productive time, then keep a separate buffer before the carrier pickup.
Set safety stock for each SKU. Use demand variation, lead time, supplier reliability, and stockout cost. One percentage across the catalog hides the products that face the greatest risk.
Train them with the devices, locations, barcode prompts, and cartons they will use. Measure a complete mixed wave. Assign a trained backup to every role that can stop the operation.
Get pickup times in writing and test every planned service. Work backward from pickup to find the last safe wave release. Validate the backup service before peak.
Multiply daily returns by inspection minutes, then divide by 60. Compare those hours with trained operator time. Reserve a quarantine area before the first parcels come back.
Continue exploring




What marketplaces read off your warehouse: availability, picking accuracy, dispatch time. Jonathan Coloma, COO of Repiauto, on going from 300 to 1,000 orders a day in two years: the paper wall, ERPs built for a different problem, a go-live quoted at fifteen days, and what changed in his working day.

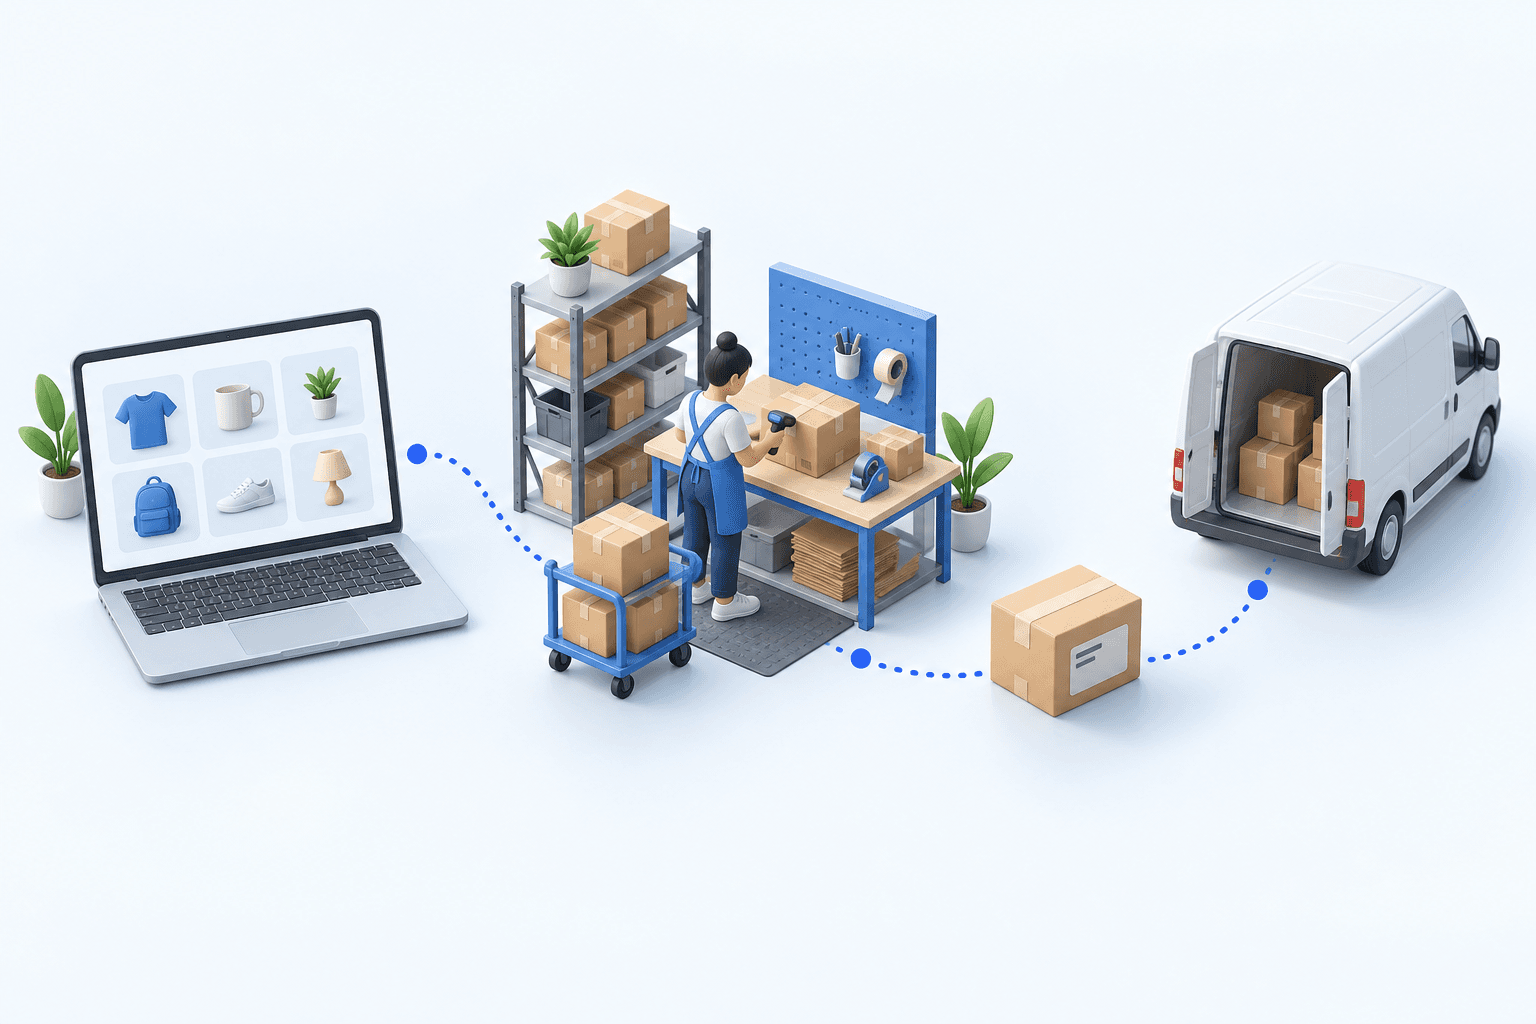
To hold up under peak volume, split the order queue into waves based on real operating constraints, then decide where barcode checks belong. At the packing bench, the operator verifies the parcel. Carrier rules select the service and print the label, so the next order can start without another decision.

Industrializing your purchasing means ordering on rules, not guesswork: at the right time (the reorder point), in the right quantity (your coverage period), from the right supplier, with a purchase order validated in one click. Available on replay.


See it in your own operations
Book a 20-minute call. We'll map your workflow and point out where it breaks. No slides.
Free 20-min call · No commitment