
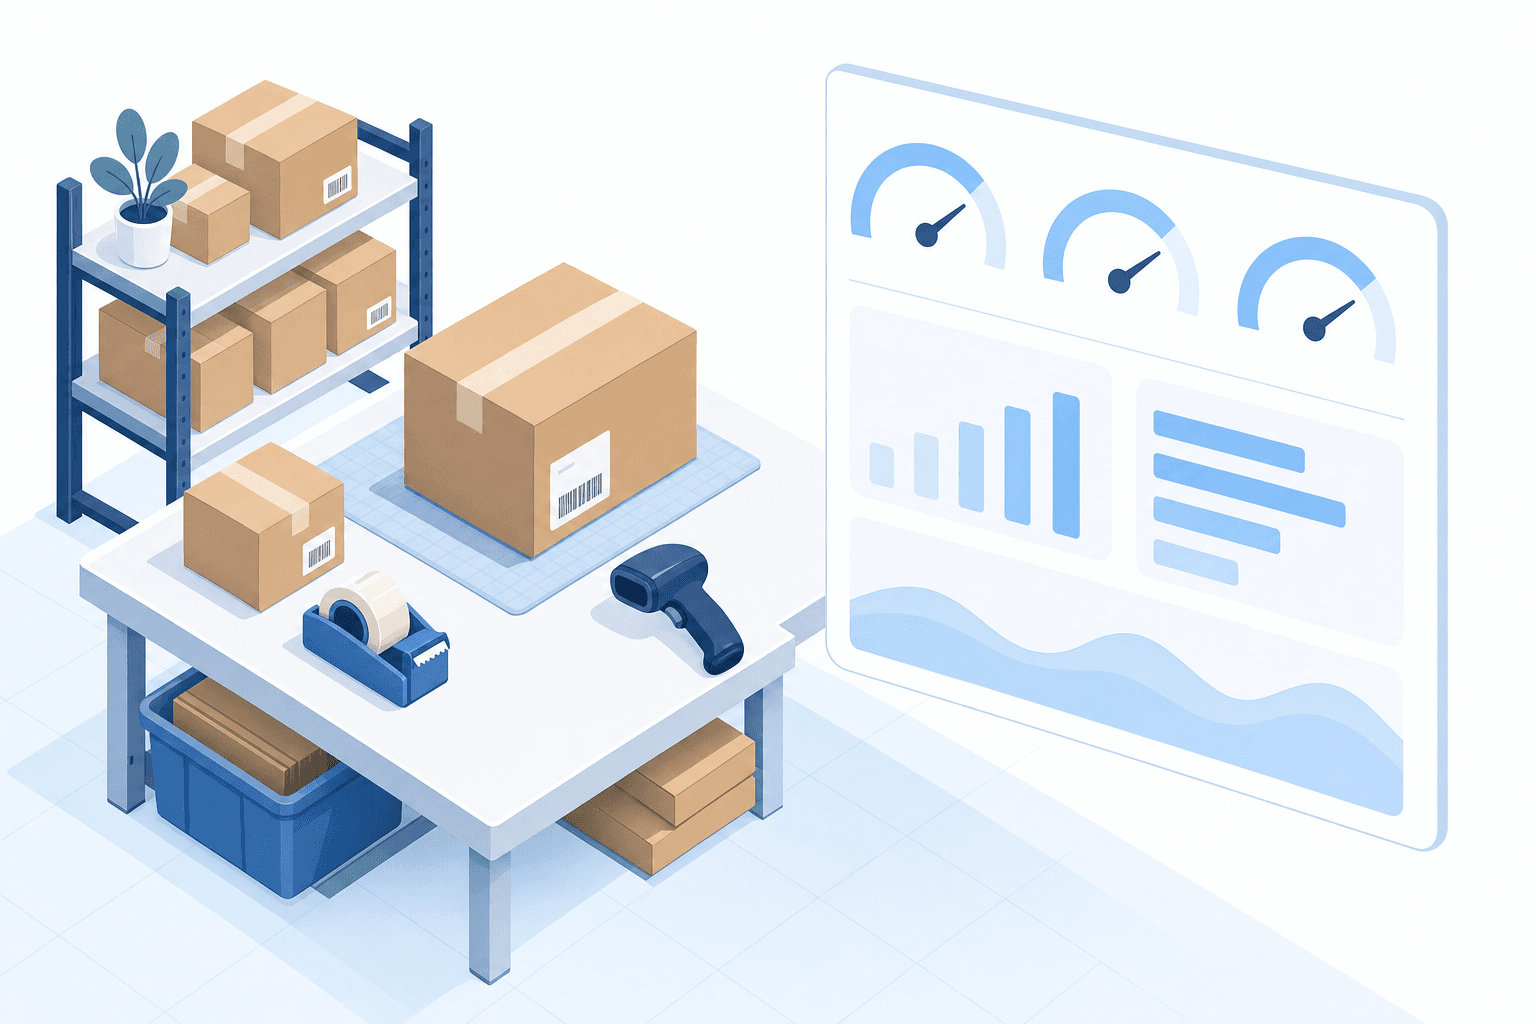
Fill Rate: Find and Fix Fulfillment Failures
Fill rate shows how much customer demand you can ship from available stock. Track it beside order fill rate, perfect order rate, picking accuracy and order-to-ship time. Together, these KPIs tell you whether the next fix belongs in inventory, order allocation, picking, packing or shipping.

The essentials
- Fill rate measures units supplied immediately; order fill rate measures complete orders. Track both: a shortage affecting few units can still leave a customer’s order incomplete.
- Perfect order rate multiplies its component rates. APQC’s example turns 98%, 97%, 99% and 82% into 77.16%, exposing defects hidden by separate averages.
- Set alert bands by SKU class and promise. One catalog-wide target can leave you overstocked on slow sellers and short of priority items.
- Trace every miss to the last control that passed. Check reservation, allocation, the pick scan, pack check, shipping label and carrier confirmation in that order.
- Review return reasons separately. Wrong-item returns belong to fulfillment; fit, preference and buyer remorse do not.
A paid order reaches the pick queue, but its last sellable unit was reserved on another channel. The pick list still sends someone to the bin. By the time the packer spots the shortage, the order can no longer ship as promised. The dashboard may still show a healthy monthly average.
Start with fill rate: the share of demand you can ship immediately from stock. Keep it separate from cycle service level, the probability of avoiding a stockout during replenishment. Write the definition beside the KPI. Otherwise, purchasing, the warehouse and your 3PL can report different answers to the same question.
| KPI | Counts |
|---|---|
| Fill rate | Units available now |
| Order fill rate | Complete orders |
| Perfect order rate | Entire promise |
| Picking accuracy | Correct picks |
| Order-to-ship time | Paid order to carrier |
| KPI | Owner · first check |
|---|---|
| Fill rate | Inventory · Sellable stock by location |
| Order fill rate | Allocation · Reservations and backorders |
| Perfect order rate | Operations · Lowest component rate |
| Picking accuracy | Warehouse · Scan exceptions |
| Order-to-ship time | Shipping · Label and confirmation queue |
Calculate fill rate before you chase warehouse speed
Use a unit-based fill rate when the question is inventory availability:
Fill rate = units shipped immediately ÷ units ordered × 100
Unfilled units count against fill rate even when the order leaves on time. Lokad’s fill-rate definition separates this from service level, which measures the probability of meeting a request. WERC’s 2025 DC Measures framework also lists line fill rate and order fill rate as separate outbound metrics.
Calculate the rate by SKU and location. A network-wide rate can hide which warehouse or 3PL is short of stock. Keep consistent rules for substitutions, split shipments, backorders and canceled lines. Track stockout days separately: demand lost before an order is placed is absent from the order denominator.
Use order fill rate to expose partial orders
Order fill rate counts orders shipped complete from stock.
Order fill rate = complete orders shipped ÷ total orders × 100
Line fill rate = order lines filled completely in the first shipment ÷ eligible order lines × 100
Count a line as filled only when its full requested quantity ships immediately. A partially filled line fails this check even if most units ship.
Use unit fill rate to measure the volume supplied and order fill rate to measure complete orders. A shortage on one low-quantity line may barely move unit fill rate, yet leave the order incomplete.
Check whether reservations and warehouse allocation left sellable units unavailable for this order. A multi-brand retailer kept multi-warehouse order splitting even when an external WMS handled warehouse execution.
Use perfect order rate when one miss spoils the order
Fill rate covers availability. Perfect order rate adds the rest of the promise: complete, on time, damage-free and correctly documented. APQC calculates it by multiplying the component rates, not averaging them. In APQC’s published example, 98% × 97% × 99% × 82% becomes 77.16%. APQC reports an 88% cross-industry median from 13,590 observations (accessed September 22, 2026).
Multiplication is useful because defects compound. A team can post respectable scores for completeness, timing and damage, then lose far more perfect orders because of documentation errors. Keep each component visible below the combined rate. Use the combined rate to monitor overall order quality and the component rates to identify the next correction.
Set the target by SKU class and shortage cost. One catalog-wide target can leave you overstocked on slow sellers and short of priority items. Lokad’s 2014 service-level definition describes retail targets typically above 95% and few store-level situations in which rates exceed 98%. Use cycle service level to assess stockout risk during replenishment; use fill rate to track demand supplied immediately.
- ReservationRelease stale reservations.
- AllocationAssign a stocked warehouse.
- Pick scanBlock a SKU mismatch.
- Pack checkCorrect contents before sealing.
- LabelFix address or service errors.
- Channel confirmationResend missing tracking.
Trace every miss to the last control that passed
Check reservation, allocation, the pick scan, pack check, shipping label and carrier confirmation in that order. If packing finds the wrong SKU, check the scan and pick list. If the carrier rejects the shipment, check the address, weight, service code and account. If the channel still shows the order as unshipped, check tracking and shipment confirmation.
Use that sequence to assign the next action. Have the inventory team investigate unavailable stock and the order management team correct orders assigned to the wrong warehouse. Send missed scan checks to the warehouse lead and failed labels or confirmations to shipping. An exception queue preserves the evidence and gives each miss an owner.
One electronics distributor centralized carrier portals, shipping labels and tracking. Its label-error rate fell from 5-8% of shipments to under 1% in the first month, while shipping-error complaints fell by more than 80%.
Calculate the cost of picking errors
Wrong-item returns can still occur when picking accuracy is high. Apply the miss rate to your order lines and inspect where each error escaped. Yale’s table of WERC’s 2025 results sets the best-in-class thresholds at ≥99.68% order-picking accuracy and ≥99.5% on-time shipments. Calculate the handling, return-shipping and replacement cost of each mispick.
Scan controls change the point of detection. The pick list directs the operator to a location; the product scan checks the SKU and quantity; a pack check stops a mismatch before the shipping label is applied. Put-away accuracy and replenishment still matter because a correct scan cannot recover inventory placed in the wrong bin.
A 3PL using guided PDA picking reports zero picking errors. A fashion brand that brought fulfillment in-house moved from an unverifiable 3-4% mispick rate to a tracked rate below 0.5% with barcode verification.
Separate warehouse-caused returns from customer choice
Return rate is an outcome, not a root cause. Split it by reason before assigning warehouse work. Wrong item, wrong quantity, damage from packing and late arrival belong in the fulfillment review. Fit, preference or buyer's remorse need a different owner. A single blended rate can rise while warehouse execution improves, or fall while a recurring mispick remains hidden.
Returns carry a substantial cost. The National Retail Federation and Happy Returns projected $890 billion in US retail returns in 2024, equal to 16.9% of annual sales, from surveys of 2,007 consumers and 249 retail professionals. Use return reason codes to calculate the share caused by wrong items, wrong quantities or packing damage.
Review wrong-item returns beside picking and pack-check exceptions. Then inspect the same SKU, location, shift and method. That turns a return into a specific put-away, replenishment, order picking or packing correction instead of a general accuracy campaign.
Protect marketplace thresholds upstream
Marketplace metrics record failures only after they occur in the warehouse. For seller-fulfilled orders, Amazon’s US seller guidance says to keep Order Defect Rate below 1%, late shipment rate below 4% and pre-fulfillment cancellation rate below 2.5% (accessed September 22, 2026). A stockout can drive a cancellation; a missed cutoff, a late shipment; a wrong item, negative feedback or a claim.
Manage the earlier signals you control: fill rate by location, open backorders, pick exceptions, boxes held at packing, label failures and unconfirmed shipments. Confirming late is still late even when the carrier collected the parcel on time, so the shipping event and channel update need their own exception queue.
A home-and-garden seller moved from shipments running 1-2 days late to same-day shipping as the standard after centralizing orders and stock. A bedroom-products seller batch-scans completed packing sheets several times a day to send tracking to 25+ channels without waiting for carrier pickup.
Base the review on exceptions, then reset the target
Start the weekly review with misses, not the average. Pull unfilled units, incomplete orders, non-perfect orders, blocked scans, late confirmations and wrong-item returns. For each one, record the last control that passed, the failed control, the owner and the corrective action. Finish by choosing a corrective action: change a stock rule, fix an allocation, correct put-away, adjust replenishment, block a scan mismatch or restore shipment confirmation.
Set each alert band from the customer commitment, SKU class and cost of a shortage.
myFulfillment order management reserves stock as orders enter and can allocate work to the warehouse that has inventory.
For the warehouse mechanics behind the controls, watch the peak-season order prep and shipping replay. For the stock decisions behind a miss, use the replenishment guide. myFulfillment warehouse management connects pick lists, scan checks, packing and shipping labels in the operating flow.
Sources
- APQC, Perfect order performance, accessed 2026.
- WERC, DC Measures 2025, 2025.
- Yale, Benchmarking and improving distribution center metrics, reporting WERC 2025 results.
- National Retail Federation and Happy Returns, 2024 Consumer Returns in the Retail Industry, 2024.
- Amazon, seller account performance and fulfillment policies, 2025.
- Lokad, Fill Rate definition, 2015.
- Lokad, Service Level definition, 2014.
Frequently asked questions
Fill rate is the share of customer demand shipped immediately from available stock, without a backorder or lost sale. Calculate it as units shipped immediately divided by units ordered, multiplied by 100. Define substitutions, cancellations and split shipments before comparing periods.
Divide complete orders shipped from available stock by total orders, then multiply by 100. Count an order as incomplete when any required line is backordered or canceled. Track unit fill rate separately so one short line does not hide inside a large order.
A good fill rate is the target that matches the SKU’s customer commitment and stockout cost. Set separate targets by SKU class and location. Review unfilled demand and replenishment costs together before raising a target that requires more inventory.
Perfect order rate is the share of orders delivered complete, on time, damage-free and correctly documented. APQC calculates it by multiplying those component rates. Keep the components visible, because the combined rate shows the outcome while each component points to a different fix.
Start with misses by SKU and location. Check sellable stock, reservations, allocation, supplier lead time and open purchase orders. Fix trapped or misallocated stock before buying more, then adjust replenishment only where the shortage and customer promise justify extra inventory.
Fill rate measures how much demand available stock can cover immediately. On-time delivery measures whether the order reached the customer by the promised time. An order can be complete but late, or on time with a backordered line, so track both.
Continue exploring

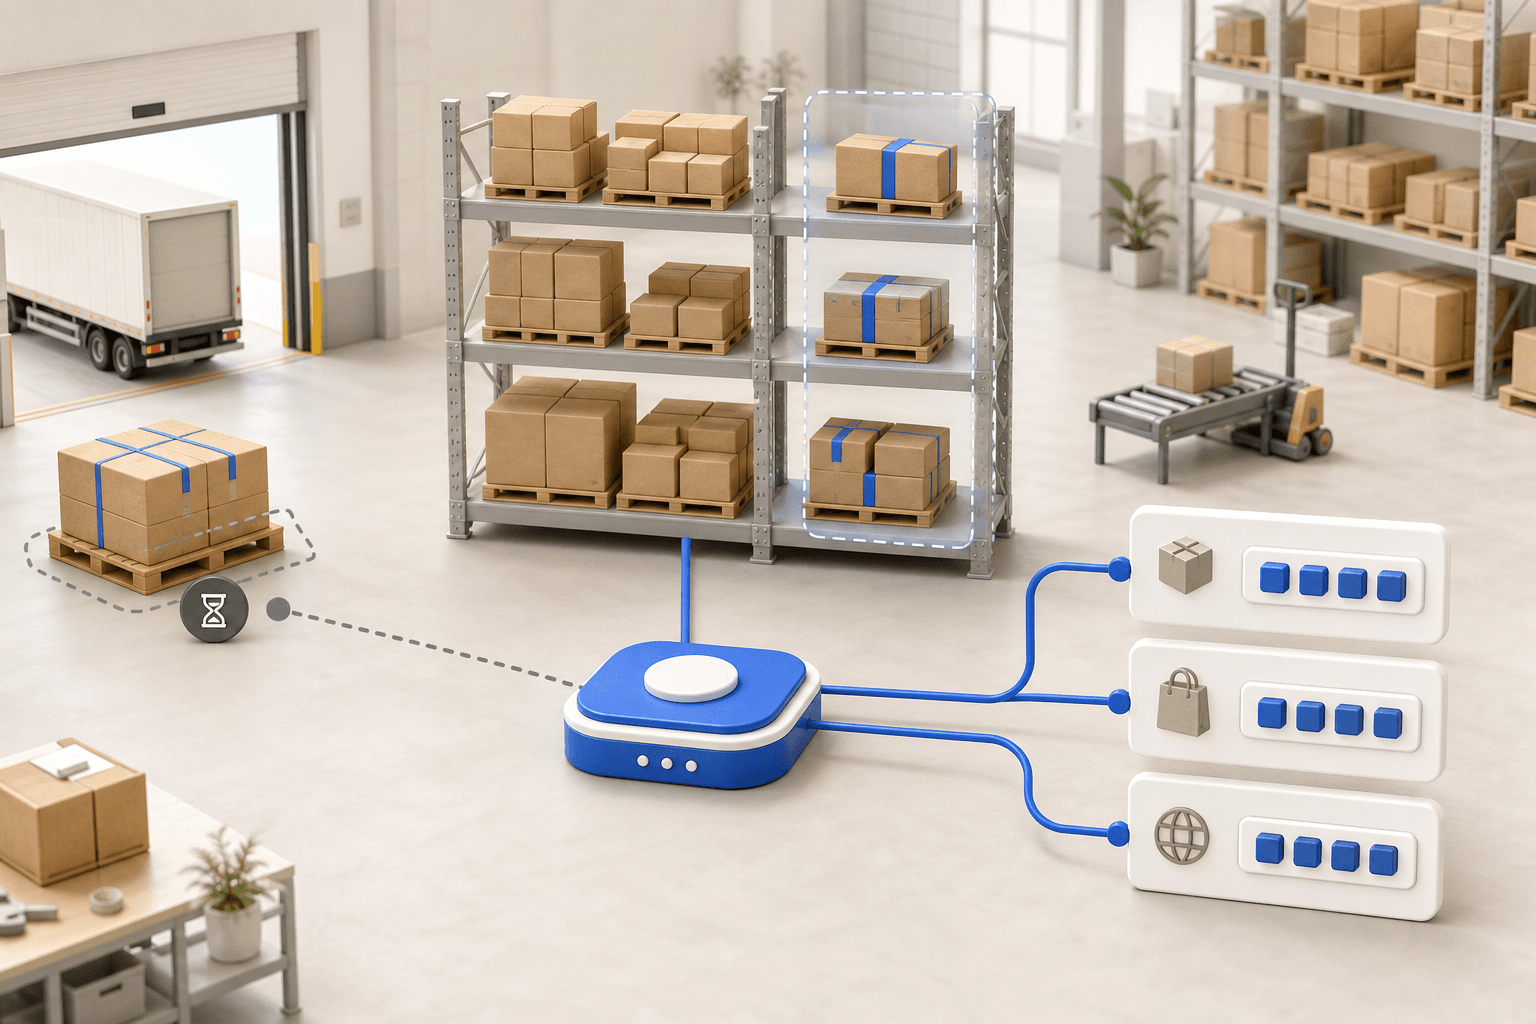




Stock availability, picking accuracy, and shipping times affect marketplace sales. Jonathan Coloma, COO of Repiauto, explains how his team went from 300 to 1,000 orders a day in two years. He describes the limits of paper-based work, ERPs built for different needs, a go-live estimate of fifteen days, and changes to his daily routine.

To hold up under peak volume, split the order queue into waves based on real operating constraints, then decide where barcode checks belong. At the packing bench, the operator verifies the parcel. Carrier rules select the service and print the label, so the next order can start without another decision.

Industrializing your purchasing means ordering on rules, not guesswork: at the right time (the reorder point), in the right quantity (your coverage period), from the right supplier, with a purchase order validated in one click. Available on replay.







See it in your own operations
Book a 20-minute call. We'll map your workflow and point out where it breaks. No slides.
Free 20-min call · No commitment